Having spent two months transforming our engineering workflow with AI, we’ve measured a 3-5x increase in development velocity — and yes, we have the data to prove it. Our engineers now ship 211% more commits, deliver 142% more features, and maintain code quality while doing it.
This is the first post in a series about our AI transformation journey at Tint. Future posts will cover topics including our revamped SDLC incorporating AI as a first-class citizen, Claude Code tips and tricks, using Linear as a context database for AI, and more insights from our ongoing transformation.
The Journey from Copilot to Claude Code
Our AI adoption wasn’t an overnight revolution — it was a measured evolution that started with GitHub Copilot at the end of 2023. We were amazed by the comfort and boost it provided. AI felt magical: we’d start writing a line of code, and it would complete the next few lines perfectly. For several months, Copilot became our standard. It was like having an intelligent autocomplete that understood context and anticipated what you needed next.
Then came the experimentation phase. Our engineering culture at Tint encourages innovation — every engineer is empowered to try solutions that might improve our workflow. Some engineers tried Cursor, but found that writing detailed prompts with all the relevant context often took more time than just writing the code with Copilot.
Others experimented with various LLMs through web interfaces, mixing approaches to leverage each model’s strengths. One engineer would get implementation plans from Gemini, feed that strategy into Claude through Cursor for the actual coding, then run the result through ChatGPT for a code review. The diversity of approaches was intentional — we wanted to see what worked best in practice, not in theory.
The breakthrough came with Claude Code. Unlike other tools, it was smart enough to figure out context automatically from high-level instructions and find its own implementation path. The trust factor changed everything — where engineers were hesitant to leave Cursor unsupervised for even a minute, they became comfortable letting Claude Code work with minimal oversight during implementation on bug fixes or entire features. Of course, engineers still thoroughly review every line of the produced output before it ships — AI writes it, but we own it.
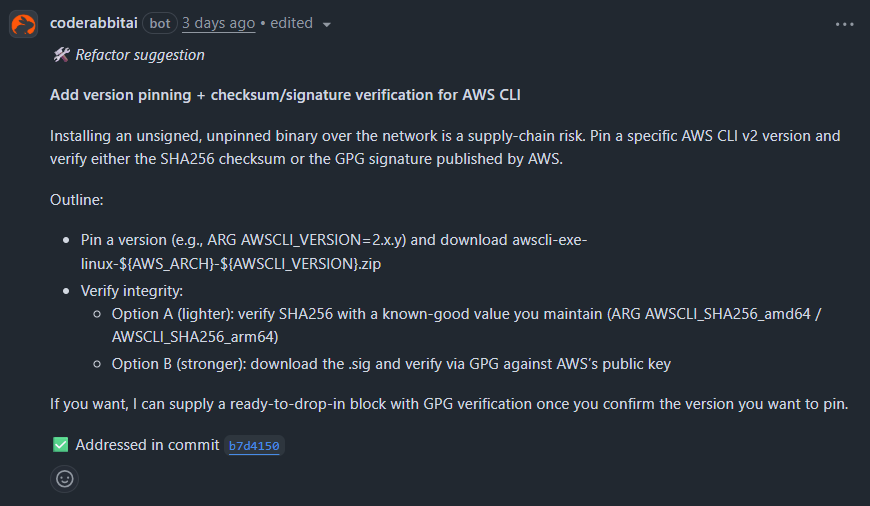
With AI dramatically increasing our PR volume, we quickly hit a new bottleneck: code reviews. We turned to CodeRabbit for help. Interestingly, we’d tried it about a year ago and were disappointed — the feedback was generic and often missed the mark. But the new version provides sharp, relevant feedback that catches edge cases, security issues, and performance concerns that even experienced engineers might miss.
Measuring What Matters: Our Metrics Framework
As the Platform Team, our mission is to improve engineering efficiency across the company. We don’t adopt tools based on hype; we adopt them based on data. Hence, we needed to have objective and measurable metrics.
Finding the right metrics is surprisingly hard — the concepts we’re trying to measure aren’t always well-defined. How do you truly measure delivered value? What constitutes productivity in modern software development? While our metrics framework is still a work in progress, we’re currently focusing on three key areas:
- Engineering Impact: Number of commits and pull requests, cycle time
- Code Quality: Average number of comments per pull request
- Business Impact: Number of resolved tickets, time to market
Important disclaimer: Every engineer explored AI at different times, making a clear overview of AI’s impact challenging. Instead of attempting a flawed company-wide analysis, we focused on a subset of individuals who started their Claude experiments on June 20th. While this reduces our sample size, it removes interfering data and provides a cleaner picture of the transformation.
The Numbers Don’t Lie
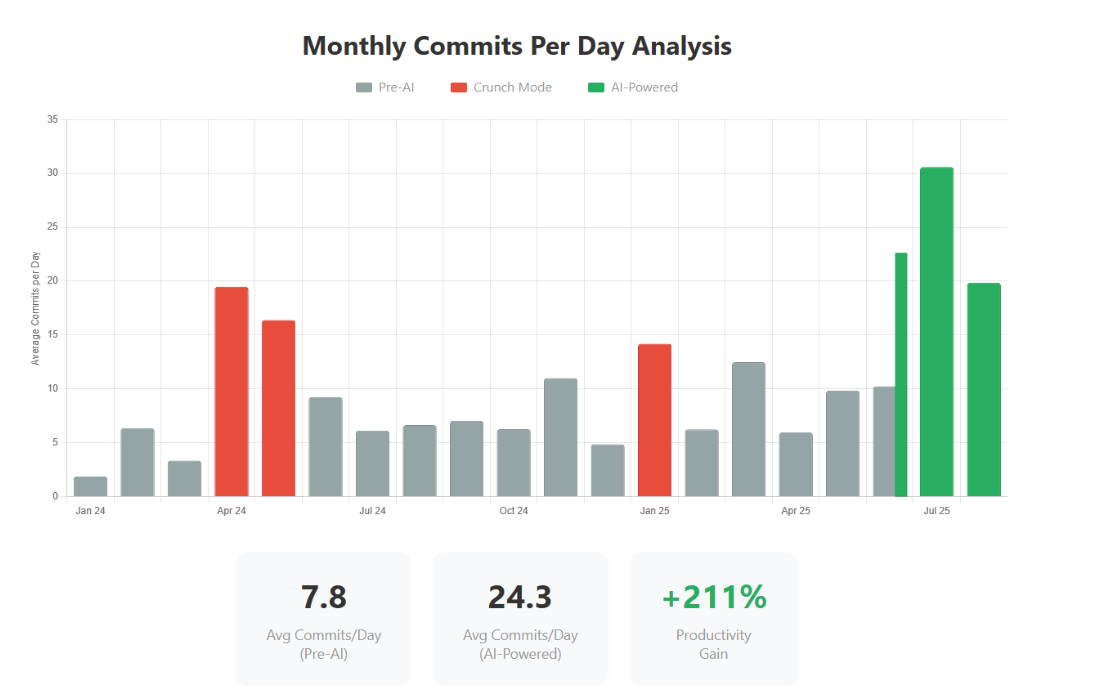
Commits Per Day: From 7.8 to 24.3
Let’s address the elephant in the room: raw metrics like commit counts are scary because they’re often misused to evaluate IC performance. Since our performance evaluations aren’t tied to these metrics, we have no incentive to cheat the system. This makes them actually useful for analyzing trends.
We leveraged git directly to retrieve commit data, then aggregated it into weekly averages of commits per working day — excluding vacations and holidays for accuracy. If you’re old-school, you can use:
git log --author="$(git config user.name)" \
  --since="2024-01-01" \
  --until="$(date +%Y-%m-%d)" \
  --format="%ad" \
  --date=format:"%Y-%W" | sort | uniq -c
Or if you’re embracing the AI era, just ask Claude Code:
Give me the number of commits from jpetitcolas, aggregated on a daily basis, from Jan. 1st 2024 to today. Export the result as a JSON file matching: [{ date: '2024-01-01', numberCommits: 42 }].
The results were staggering: we went from an average of 7.8 commits per working day to 24.3 — a 211% increase. The July 2025 peak shows over 30 commits per day, sustained productivity that would have been physically impossible before AI.
Pull Requests: Doubling Our Output
For pull requests, we used the GitHub GraphQL API to track creation patterns. We asked Claude Code:
From GitHub, get all pull requests created by jpetitcolas from Jan. 1st 2024 to today. Using @time_off_dates.json, calculate the average number of PRs per working day for each week. Export the result as [{ "week": "2025-08-18", "prsPerDay": 1.2 }].
The data shows we moved from 2.0 PRs per day to 4.4 on average, representing a 124% productivity gain. What’s remarkable is that our AI-powered baseline now exceeds our previous crunch mode performance (3.5 PRs/day) while being completely sustainable.
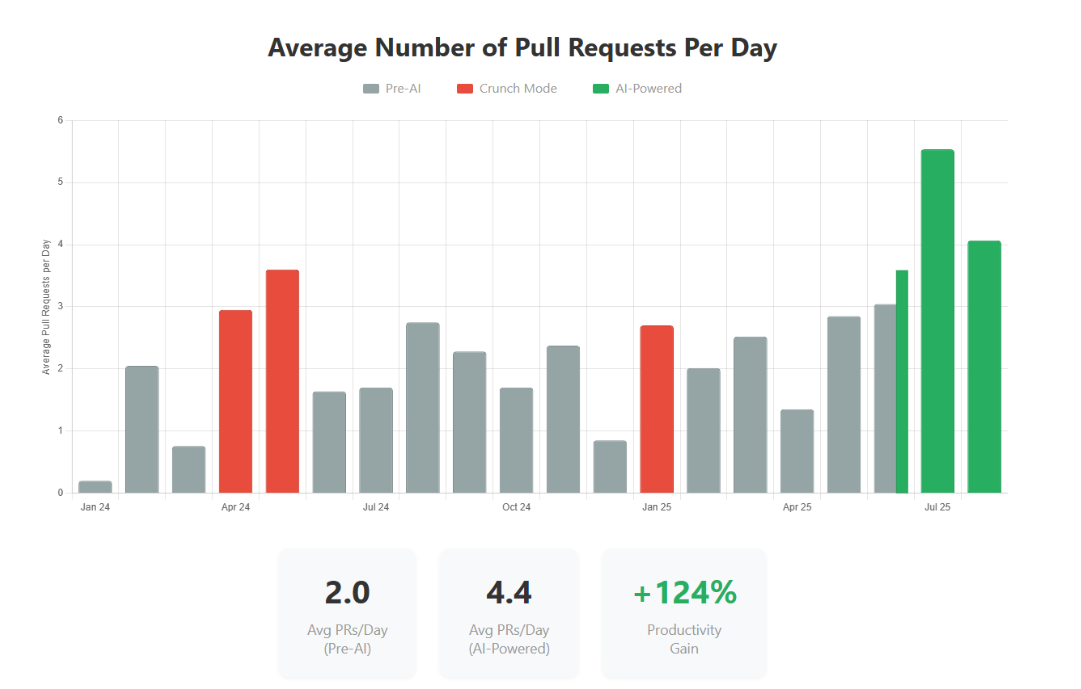
This isn’t about working harder — it’s about working fundamentally smarter. The secret lies in how AI enables parallelization. While one Claude agent works on implementing a feature, engineers can switch to supervising a second agent on a different task, then a third. Engineers have evolved into agent orchestrators, managing multiple parallel workstreams instead of being stuck in sequential development.
Cycle Time: The Review Bottleneck
Cycle time measures how quickly we move from code to production (from the first commit to the merged PR). We prompted Claude:
Analyze the cycle time for all my merged PRs from Jan. 1st 2024 to today. Calculate the average cycle time (from PR creation to merge) per week, excluding weekends and holidays from @time_off_dates.json. Export as [{ "week": "2025-08-18", "avgCycleHours": 18.5 }].
Here we discovered an interesting pattern. Pre-AI, our average cycle time was 18 hours. With AI adoption, it initially increased to 29.6 hours — a 65% increase.
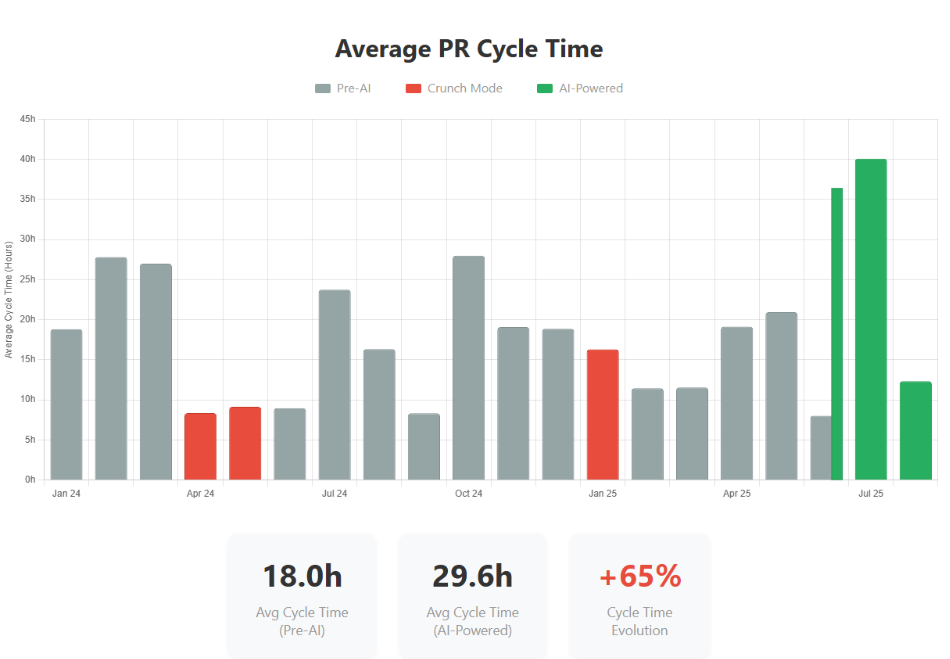
This is easily explained: when you’re delivering 2-3x more pull requests, code review becomes the bottleneck. More code means more review time, and our human review capacity didn’t scale proportionally. This is precisely why we introduced CodeRabbit. The preliminary results are promising — we’re already seeing cycle times trending back down while maintaining our increased throughput.
Code Quality: More Comments, Better Reviews
We also wanted to understand how AI affected our code review process. We asked Claude Code to analyze this:
Give me the average number of comments per pull request for the same period, aggregated by week.
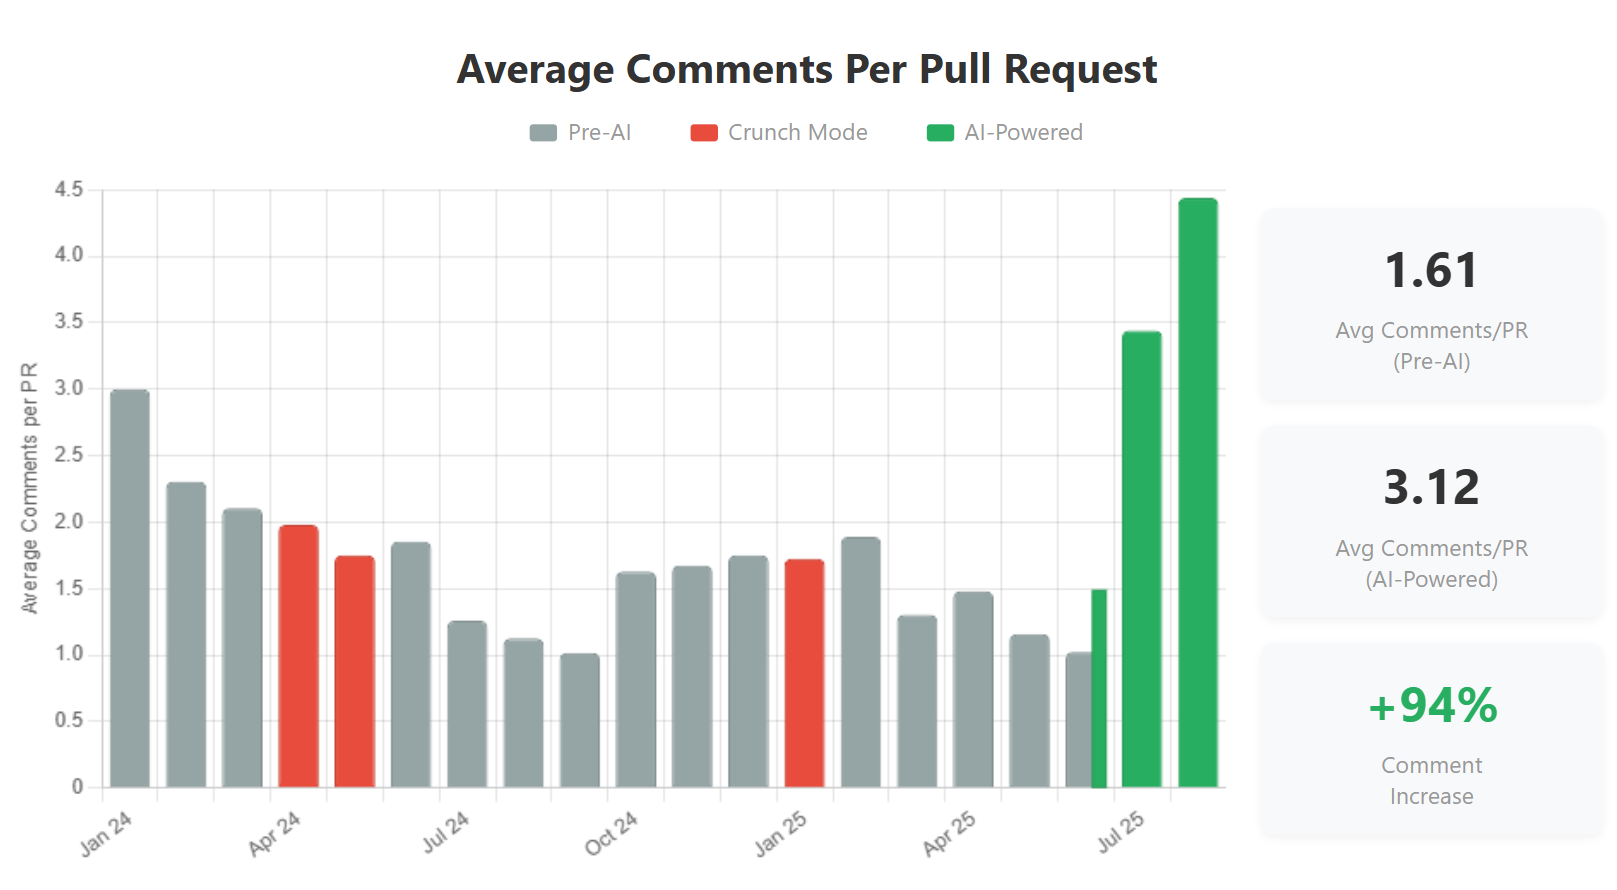
At first glance, the 94% increase in comments per PR (from 1.61 to 3.12) might seem concerning. However, this spike is primarily due to implementing CodeRabbit on July 3rd. CodeRabbit dramatically increased the number of comments, but for good reasons: it catches issues that human reviewers might miss, provides consistent feedback across all PRs, and educates developers on best practices.
The higher comment count actually reflects a more comprehensive review process. While human reviewers focus their expertise on business logic, architecture decisions, and user impact, CodeRabbit handles the technical minutiae — catching edge cases, performance issues, and potential bugs. It’s a perfect partnership: humans excel at understanding context and intent, while AI excels at systematic technical analysis.
Business Impact: Where Metrics Meet Reality
For business impact, we turned to Linear’s GraphQL API to track ticket completion. This proved more complicated than planned — we initially tried using Claude Code with the Linear MCP integration, but it had too many limitations for our analysis needs. After multiple iterations working directly with Linear’s GraphQL API, we finally crafted the right queries (which we’ll spare you for brevity’s sake).
The results are crystal clear: we’ve achieved a 142% increase in completed tickets per day (from 0.9 to 2.1). This isn’t just about writing more code — it’s about delivering more value.
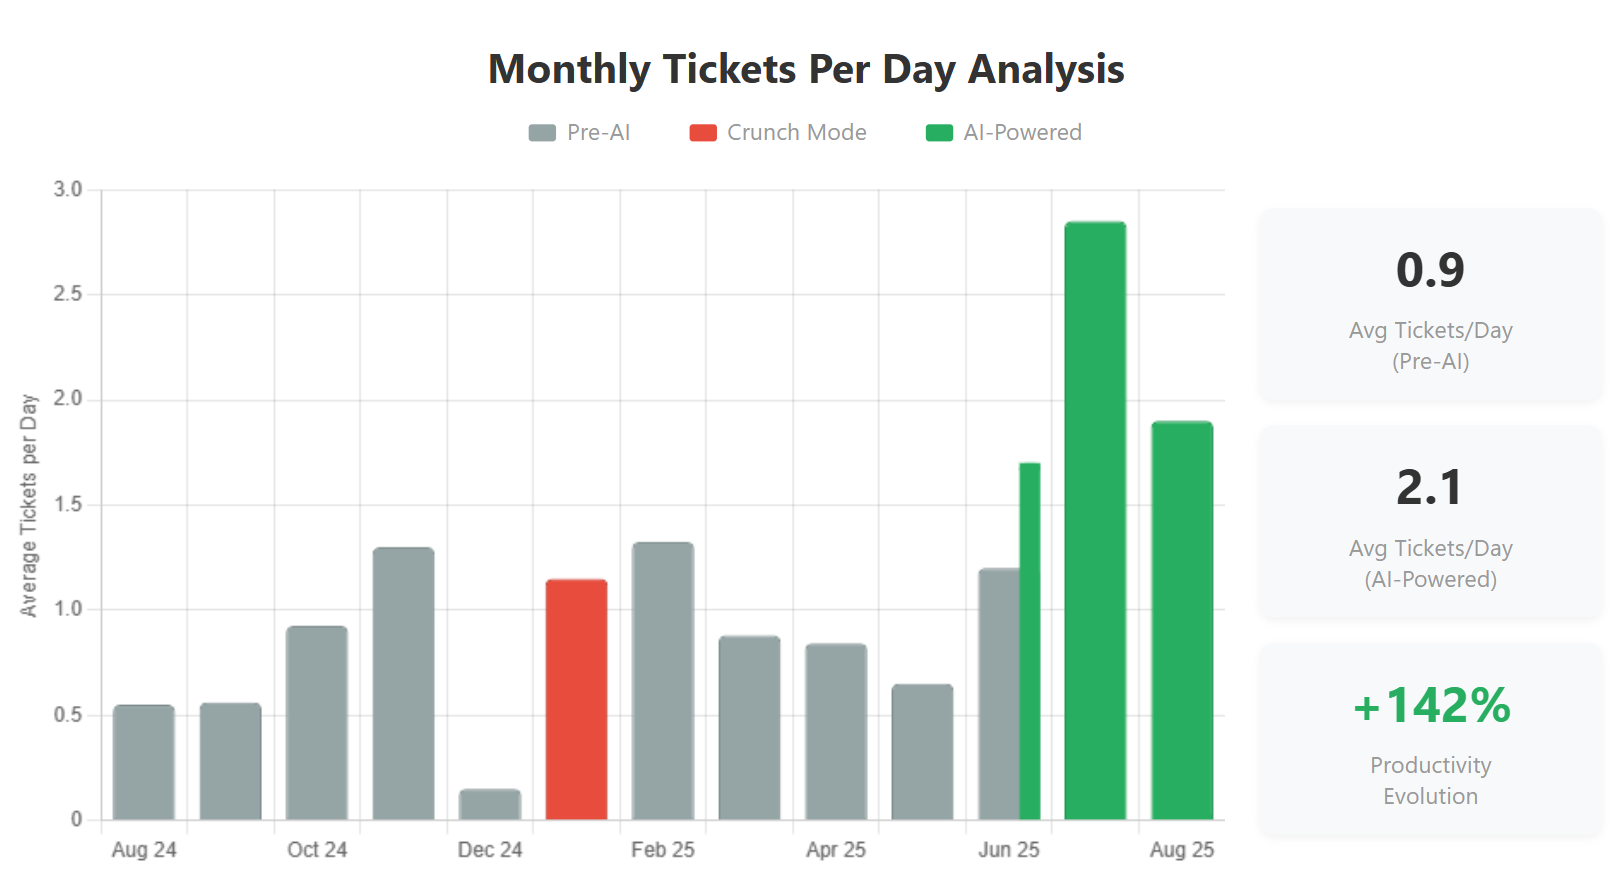
Most importantly, the increased PRs and commits have a direct business correlation — we’re not gaming the metrics. The ~2.5x increase in delivered features proves that our engineering productivity gains translate directly into customer value. More code shipped means more problems solved, more features delivered, and more value created for our users.
The Real 3-5x Factor
Based purely on these measurable code-related metrics, we’re seeing a solid 2-2.5x productivity increase. But here’s the thing: these numbers only capture part of the story.
AI’s impact extends far beyond code generation. It accelerates our architecture discussions by proposing alternatives we hadn’t considered. It transforms troubleshooting — AI can analyze our logs and identify misconfigurations in seconds, tasks that would take at least 10x more time just to examine the logs manually. It helps with reliability improvements by suggesting best practices from across the industry. It even assists in writing documentation, creating test scenarios, and refactoring legacy code.
We don’t have objective measures for these enhancements yet — how do you quantify the time saved researching the right cloud provider or architecture pattern? Or the value of accelerated RFC discussions where AI instantly provides pros and cons from industry best practices? These improvements undoubtedly double or triple the measurable gains, bringing us to our 3-5x overall estimate.
The Compelling ROI Story
Here’s the bottom line: even at these prices, AI is ridiculously cost-effective. One challenge we faced: Anthropic doesn’t provide an easy way to track your actual token usage when you’re on a subscription plan, making it hard to evaluate the ROI. That changed when we discovered npx ccusage@latest:
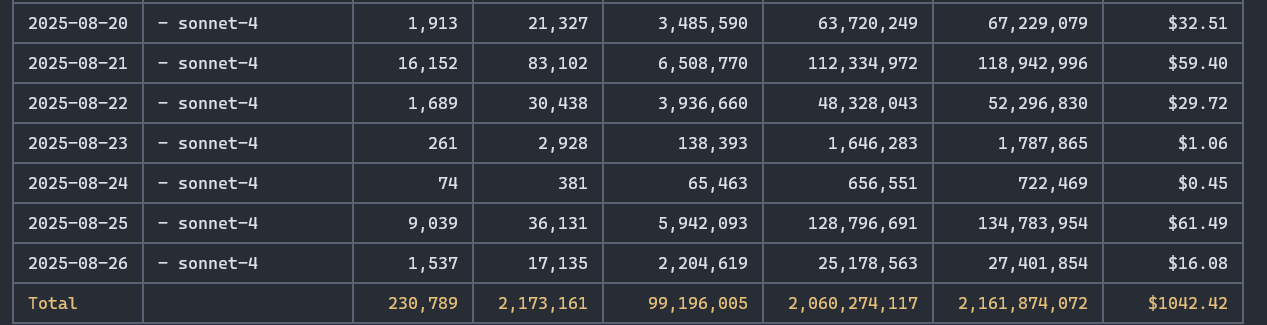
My personal monthly usage averages around $1,100 worth of tokens on the $100 Claude Code plan. I occasionally hit rate limits, but not frequently enough to justify upgrading to the $200 tier.
Our advice: start with the cheapest plan ($20/month) and see how it goes. If you find yourself hitting rate limits too often and it’s disrupting your workflow, upgrade to the next tier. Most of our engineers found the $100 tier hits the sweet spot.
This highlights the advantage of subscription-based pricing over pay-per-token models. Claude Code’s subscription tiers ($20, $100, or $200 per month) provide predictable costs while offering tremendous value — in my case, getting $1,100 worth of API tokens for $100. That’s over 10x value just from the subscription model, making it a no-brainer for any engineer seriously using AI in their workflow.
For teams, the math becomes even more compelling. The productivity gains we’ve measured — 2-3x on code output, 2.5x on delivered features — far exceed the modest subscription costs. When a $100/month tool can double an engineer’s output, the ROI is immediate and undeniable.
The Transformation Is Real
Looking at our comprehensive metrics, the AI transformation has fundamentally changed how we deliver software:
- Velocity: We’re shipping 2-3x more code while maintaining quality. Our AI-powered baseline now exceeds what previously required unsustainable crunch modes.
- Quality: The 94% increase in PR comments reflects a more thorough review process. CodeRabbit catches technical issues systematically, freeing human reviewers to focus on architecture and business logic.
- Business Value: The 142% increase in completed tickets proves these aren’t vanity metrics — we’re delivering ~2.5x more value to customers.
- Efficiency: Despite the initial increase in cycle time due to review bottlenecks, we’re solving this with AI-powered reviews. The net result is dramatically higher throughput without sacrificing quality or burning out our team.
The crucial principle we’ve established is this: engineers remain 100% responsible for code shipped to production. AI writes it, but we own it — bugs and all. This ownership mindset ensures that AI remains a tool, not a crutch. Every line of AI-generated code must be understood, validated, and approved by a human engineer before it reaches our customers.
What’s Next
This transformation journey is ongoing, and we’re learning something new every day. The future of engineering isn’t about writing more code faster — it’s about solving the right problems at the right level of abstraction.
In upcoming posts, we’ll dive deeper into topics like (non-exhaustive list):
- Redefining the engineer’s role in the AI era
- Struggles and challenges of AI adoption
- Efficient context management using ticket trackers as knowledge bases
- Practical Claude Code tips and tricks
- And more insights as our AI transformation continues to evolve
Have you started using AI in your development workflow? What metrics are you tracking to measure its impact? We’d love to hear about your experiences — reach out to us on Twitter/X or LinkedIn!
About the author
